# Tables Functions Documentation
Pyret has three different notations for manipulating Tables (each makes sense for someone starting Tables with a different goal or prior knowledge about programming). The version we are using, based on functions, is not covered in the Pyret documentation, but it is in the [textbook](https://dcic-world.org). This page summarizes the functions you can use to manipulate Tables.
:::info
Use this, not the Pyret Documentation, for working with Tables!
:::
:::danger
## Important: loading in the table functions
**To load in the table functions, you should change the "context" (the bundle of built-in functions that Pyret loads in when you press Run) to `dcic2024`.**
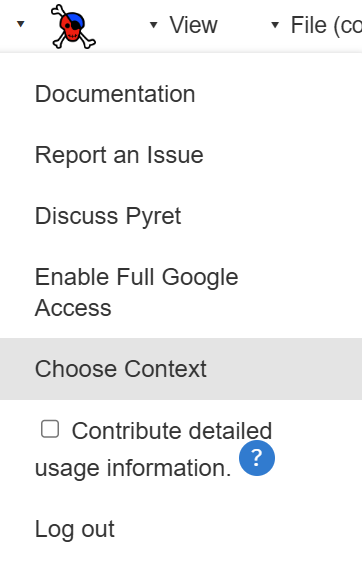
Press the Pyret skull icon at the top-left of the Pyret window to open the menu, and select "choose context:"
Type in `dcic2024` and press Submit:
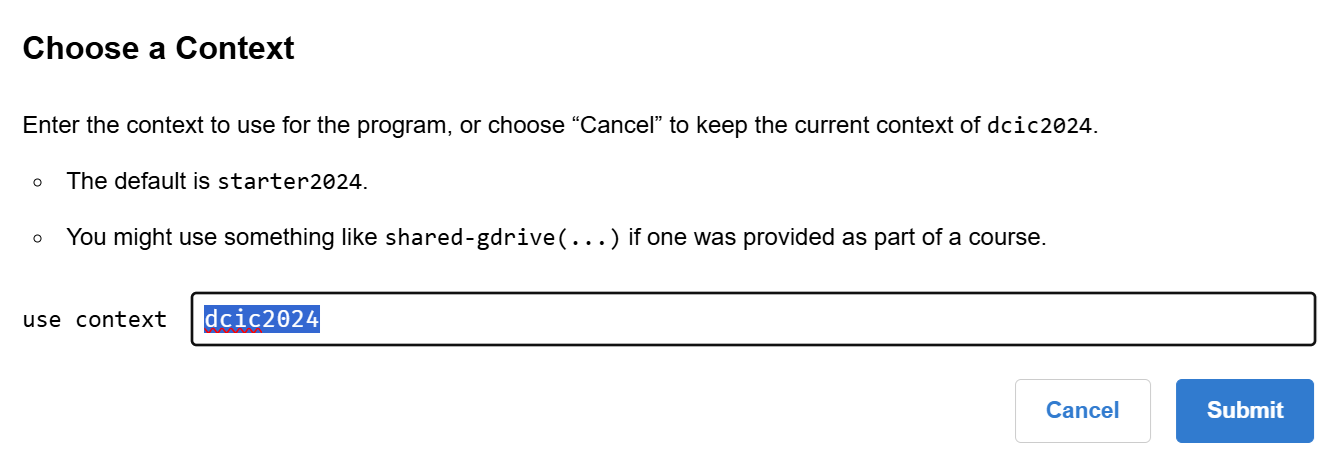
Now, line 1 of the Pyret file will be `use context dcic2024` instead of `use context starter2024`:

:::
:::info
Many of the examples given for the functions described below will be using the Table called `my-table` created in the section below, ["Creating a Table from Scratch."](#Creating-a-Table-from-Scratch)
:::
---
## Creating a Table from Scratch
If we want to explicitly define a `Table`, we can write it using this syntax:
```
table: col0-name :: col0-type, col1-name :: col1-type, ...
row: r0c0, r0c1, ...
row: r1c0, r1c1, ...
row: r2c0, r2c1, ...
...
end
```
* **Example:**
```
my-table = table: name :: String, age :: Number, favorite-color :: String
row: "Bob", 12, "blue"
row: "Alice", 17, "green"
row: "Eve", 13, "red"
end
```
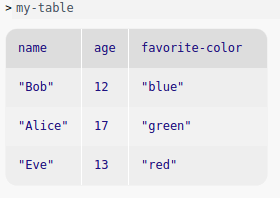
Evaluating `my-table` in the interactions window after running the program above will display a formatted version of the `Table`:
---
## Accessing a Row or Value in a Table
**Getting a row**: To get a specific row number from the table, use `row-n` from the standard Pyret documentation.
* **Example:**
```>>> my-table.row-n(0)```
**Getting a value**: The syntax `my-row[col-name]` accesses a `Row` at a particular column, resulting in a particular value. e.g. `my-row["age"]`→`20`.
To get a particular value in a `Table`, put these two together, e.g. `my-table.row-n(0)["age"]` would retrieve the value for the column "age" in the first row of the `Table`.
* **Example:**
```
>>> my-table.row-n(0)["age"]
12
```
```
>>> alice-row = my-table.row-n(1)
>>> alice-row["favorite-color"]
"green"
```
---
## Creating and Extracting Tables
#### ***filter-with***(t :: Table, keep :: (Row -> Boolean)) -> Table
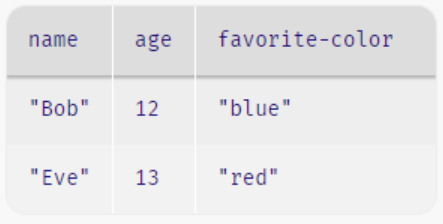
Given a `Table` and a predicate (e.g. lambda expression) on rows, returns a `Table` with only the rows for which the predicate returns `true`.
* **Example:**
Suppose we wanted to keep only rows of `my-table` that have an "age" value less than 15. We would write the expression:
```
filter-with(my-table, lam(r): r["age"] < 15 end)
```
#### ***order-by***(t :: Table, colname :: String, sort-up :: Boolean) -> Table
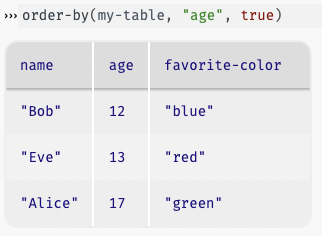
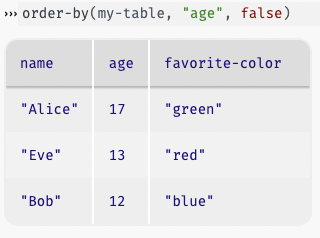
Given a `Table` and the name of a column in that `Table`, return a `Table` with the same rows ordered based on the named column. If `sort-up` is `true`, the `Table` will be sorted in ascending order, otherwise it will be in descending order.
* **Examples:**
#### ***build-column***(t :: Table, colname :: String, builder :: (Row -> A)) -> Table
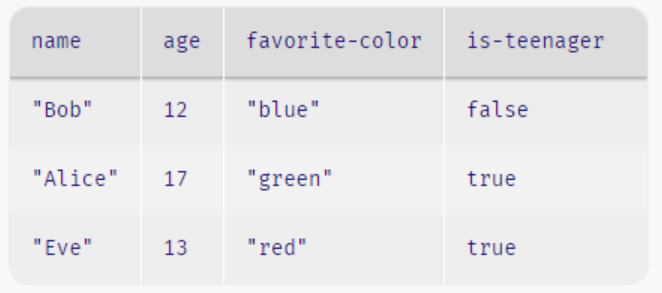
Consumes an existing `Table` and produces a new `Table` containing an additional column with the given `colname`, using `builder` to produce the values for that column, once for each row.
Here, `A` is the type of the new column, determined by the type of value the `builder` predicate produces.
* **Example:**
Suppose we wanted to create a column that tells us whether or not the value in each `Row`'s "age" column is in the 'teens' (i.e. thir*teen* to nine*teen*). Here is how we would accomplish this with a lambda expression:
```
build-column(my-table, "is-teenager", lam(r): (r["age"] >= 13) and (r["age"] < 20) end)
```
#### ***add-row***(t :: Table, r :: Row) -> Table
Consumes a `Table` and a `Row` to add, and produces a new `Table` with the rows from the original table followed by the given `Row`.
* **Example:**
Suppose we have this other table, inspiringly named `other-table`, and we want to add its second `Row` to our original table, `my-table`:
```
other-table = table: name :: String, age :: Number, favorite-color :: String
row: "Julia", 21, "marigold"
row: "Colton", 19, "blue"
row: "Monica", 20, "purple"
row: "Giselle", 21, "red"
end
```
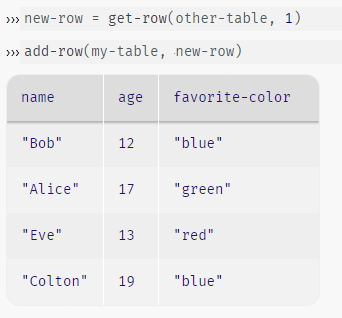
(*note: the get-row expression in the figure should be `other-table.row-n(1)`*)
#### ***add-col***(t :: Table, colname :: String, c-vals :: List<Any>) -> Table
:::warning
Note that this function uses `List`s and so should not be used for CS111 HW3/Project 1
:::
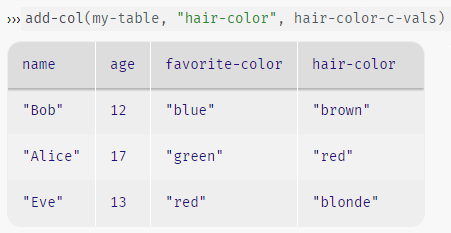
Consumes a `String` representing a column name and a `List` of values and produces a new `Table` with the columns of the input `Table` followed by a column with the given name and values. Note that the length of `c-vals` must equal the length of the `Table`.
* **Example:**
Here's a `List<String>` representing hair colors, which we want to add to `my-table` as a column:
```
hair-color-c-vals = [list: "brown", "red", "blonde"]
```
#### ***select-columns***(t :: Table, colnames :: List<String>) -> Table
:::warning
Note that this function uses `List`s and so should not be used for CS111 HW3/Project 1
:::
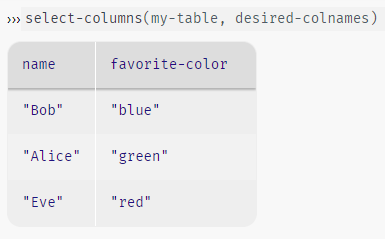
Consumes a `Table` and a `List<String>` containing column names, and produces a new `Table` containing only those columns. The order of the columns is as given in the input `List`.
* **Example:**
```
desired-colnames = [list: "name", "favorite-color"]
```
#### ***transform-column***(t :: Table, colname :: String, f :: (A -> B)) -> Table
Consumes a `Table`, a `String` representing a column name, and a transformation function and produces a new `Table` where the transformation function has been applied to all values in the named column. The values in the original column are of type `A` (the input type of the function) and values in the new column have type `B` (the output type of the function).
* **Example:**
Suppose the rows of `my-table` represent a family whose last name is "Smith." We want to change each name in the "name" column to whatever `String` is currently in the column plus the `String` " Smith" after it.
Here is a transformation function for this example:
```
fun add-last-name(name :: String) -> String:
doc: "consumes a String; returns that String + ' Smith'"
name + ' Smith'
end
```
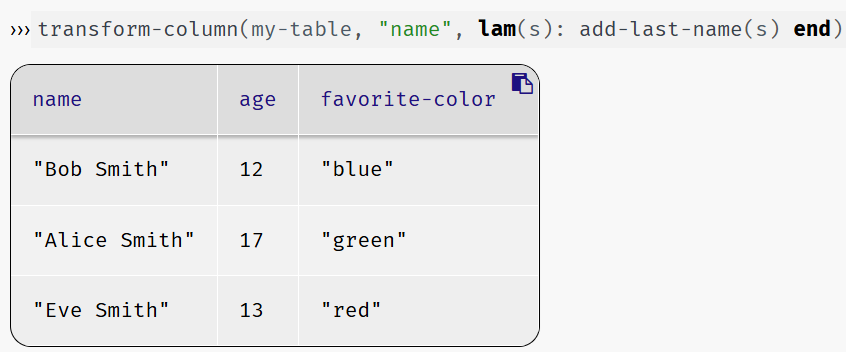
**Note the use of the lambda:** instead of `lam(r)`, we are writing `lam(s)`, to remind ourselves that the last input to `transform-column` is a function that works on the type of data inside the column to be transformed (in this case, `String`), rather than a `Row` (as was the case for `filter-with` and `build-column`). An alternate way of writing the expression without our helper function would be `transform-column(my-table, "name", lam(s): s + " Smith" end)`.
---
## Extracting Data Through Table Methods
Table methods are how we extract data from a table. Methods are similar in spirit to functions, but their notation (*table.operation(args)*) is more suggestive of going inside a table to extract data.
#### ***t.length***() -> Number
For the `Table` named `t`, returns a `Number` representing the number of rows in the `Table`.
* **Example:**
```
>>> my-table.length()
3
```
#### ***t.get-column***(colname :: String) -> List<A>
:::warning
Note that this function uses `List`s and so should not be used for CS111 HW3/Project 1
:::
Returns a `List` of the values in the named column in the `Table` named `t`. `A` is the type of the data in the named column.
* **Example:**
```
>>> my-table.get-column("name")
[list: "Bob", "Alice", "Eve"]
```
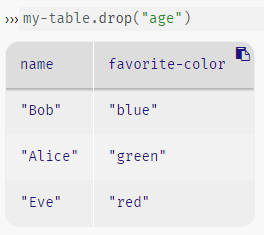
#### ***t.drop***(colname :: String) -> Table
Returns a `Table` that is the same as `Table` `t`, except without the column whose name is `colname`.
* **Example:**
---
## Summarizing Columns
#### ***sum***(t :: Table, colname :: String) -> Number
Takes a `Table` and a `String` representing the name of a column in that `Table`. Returns a `Number` representing the sum of the values in the column. Note that the given column must contain `Number` values.
* **Example:**
```
>>> sum(my-table, "age")
42
```
#### ***mean***(t :: Table, colname :: String) -> Number
Takes a `Table` and a `String` representing the name of a column in that `Table`. Returns a `Number` representing the mean (average value) of values in the column. Note that the given column must contain `Number` values
* **Example:**
```
>>> mean(my-table, "age")
14
```
#### ***median***(t :: Table, colname :: String) -> Number
Takes a `Table` and a `String` representing the name of a column in that `Table`. Returns a `Number` representing the median (middle value) of values in the column. Note that the given column must contain `Number` values.
* **Example:**
```
>>> median(my-table, "age")
13
```
#### ***modes***(t :: Table, colname :: String) -> List<A>
:::warning
Note that this function uses `List`s and so should not be used for CS111 HW3/Project 1
:::
Takes a `Table` and a `String` representing the name of a column in that `Table`. Returns a `List<Number>` containing the modes (most frequently occurring values) in the given column, where `A` is the type of data in the given column.
* **Examples:**
```
>>> modes(my-table, "age")
[list: ]
```
```
new-table = table: color :: String
row: "blue"
row: "blue"
row: "red"
end
```
```
>>> modes(new-table, "color")
[list: "blue"]
```
#### ***stdev***(t :: Table, colname :: String) -> Number
Takes a `Table` and a `String` representing the name of a column in that `Table`. Returns a `Number` representing the standard deviation (a measure of how spread out values are) of the values in the given column. Note that the given column must contain `Number` values.
:::warning
**Warning:** `stdev` produces `Roughnum` values (Pyret's way of representing approximations of irrational numbers), which may not work with some operations (for example, `order-by` cannot be called on a column containing `Roughnums`). You can convert a `Roughnum` to a rational number using [`num-to-rational`](https://www.pyret.org/docs/latest/numbers.html#%28part._numbers_num-to-rational%29), which you can then use in conjuction with `transform-column`.
:::
* **Example:**
```
>>> stdev(my-table, "age")
~2.160246899469287
```
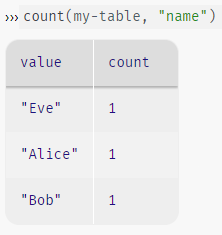
#### ***count***(tab :: Table, colname :: String) -> Table
Takes a `Table` and a `String` representing the name of a column in that `Table`. Produces a `Table` that summarizes how many rows have each value in the given column.
* **Example:**
---
## Plots and Charts
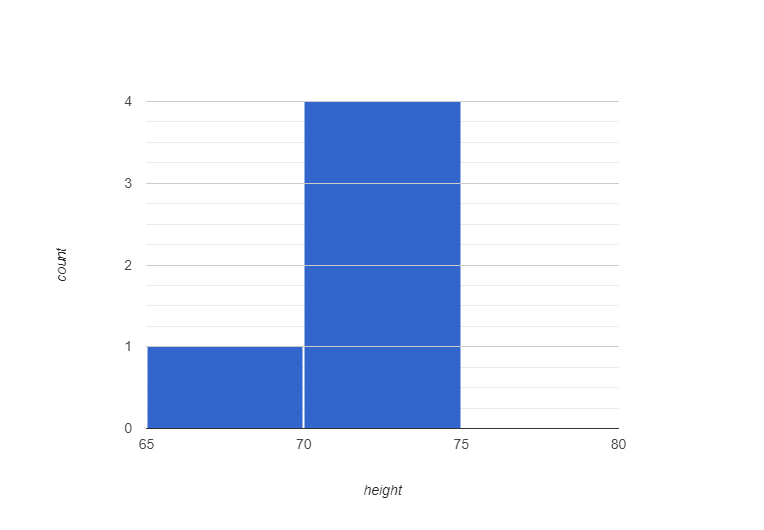
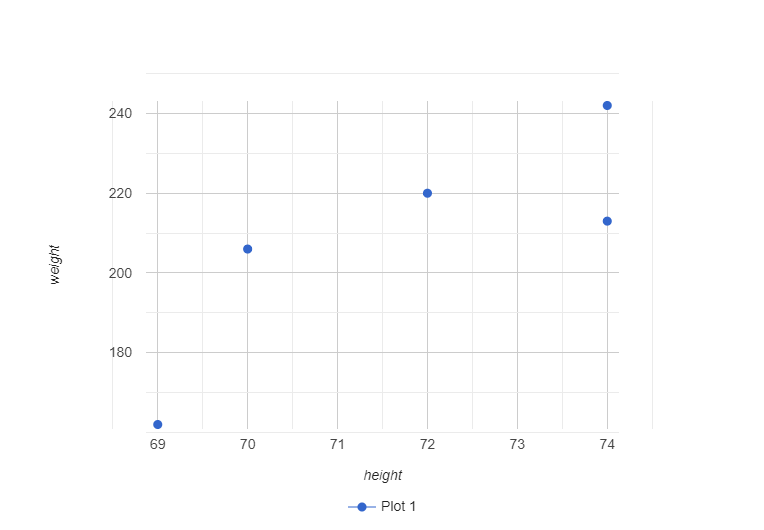
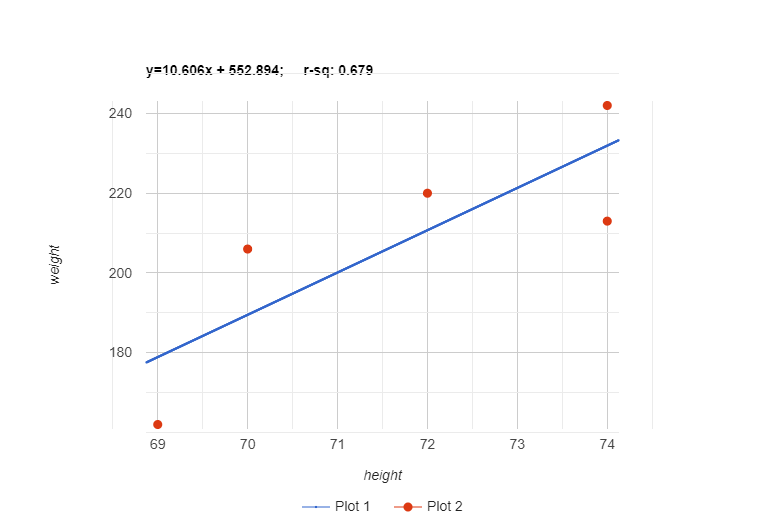
In this section, we'll use the following table of heights and weights, `height-weight-table` to illustrate many of the following plot and chart functions:
```
height-weight-table = table: height :: Number, weight :: Number
row: 74, 242
row: 69, 162
row: 74, 213
row: 72, 220
row: 70, 206
end
```
#### ***histogram***(t :: Table, colname :: String, bin-width :: Number) -> Image
Displays an `Image` of a histogram of values in the named column, which must contain numeric data. `bin-width` indicates the width of bins in the histogram.
* **Example:**
```
>>> histogram(height-weight-table, "height", 3)
```
#### ***scatter-plot***(t :: Table, xs :: String, ys :: String) -> Image
Displays an `Image` of a scatter plot from the given table. `xs` names the column in `t` to use for x-values, and `ys` names the column in `t` to use for y-values. Both columns must contain `Number` values.
* **Example:**
```
>>> scatter-plot(height-weight-table, "height", "weight")
```
#### ***lr-plot***(t :: Table, xs :: String, ys :: String) -> Image
Like a call to `scatter-plot` with the same inputs. The difference is that a linear regression will be attempted on the elements of the plot, and a regression line will the be drawn over the data.
* **Example:**
```
>>> lr-plot(height-weight-table, "height", "weight")
```
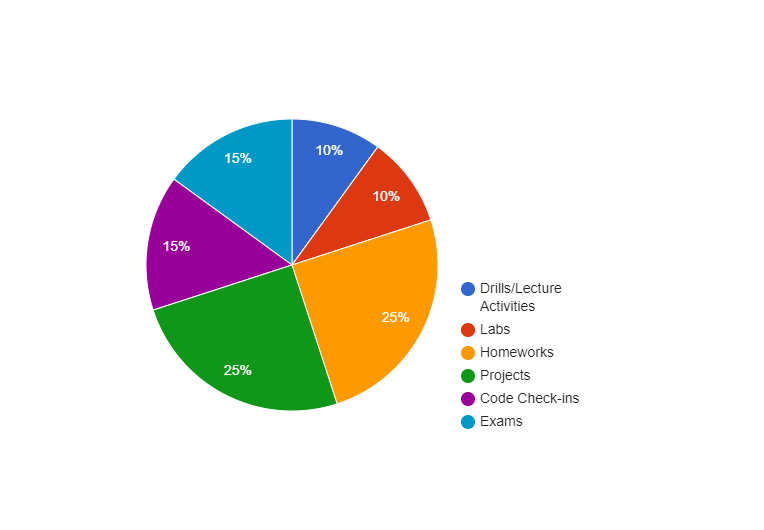
#### ***pie-chart***(t :: Table, ls :: String, vs :: String) -> Image
Display an `Image` of a pie-chart from the given `Table` (one slice per row). `ls` is the label to use for the chart, and `vs` names the column of the `Table` to use for values in the pie chart.
* **Example:**
```
cs111-syllabus-table = table: course-component :: String, grade-weight :: Number
row: "Drills/Lecture Activities", 10
row: "Labs", 10
row: "Homeworks", 25
row: "Projects", 25
row: "Code Check-ins", 15
row: "Exams", 15
end
```
```
>>> pie-chart(cs111-syllabus-table, "course-component", "grade-weight")
```
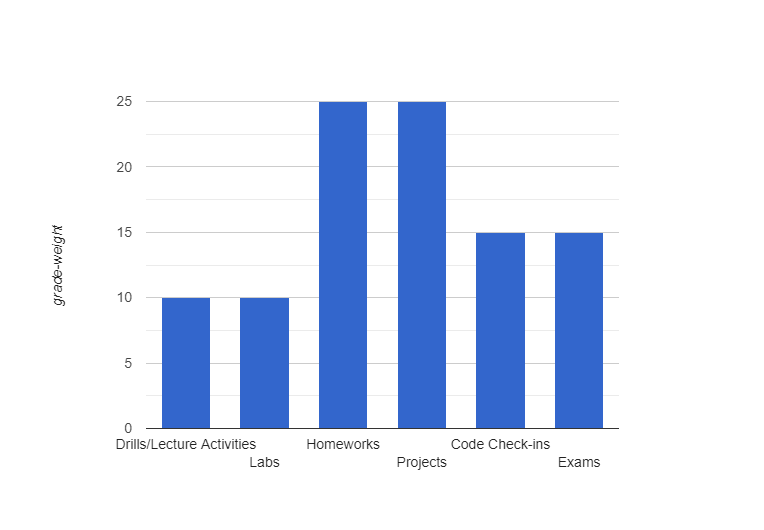
#### ***bar-chart***(t :: Table, ls :: String, vs :: String) -> Image
Displays an `Image` of a bar-chart from the given `Table` (one bar per row). `ls` names the column of the `Table` to use for labels, and `vs` names the column of the `Table` to use for values in the bar chart.
* **Example:**
```
cs111-syllabus-table = table: course-component :: String, grade-weight :: Number
row: "Drills/Lecture Activities", 10
row: "Labs", 10
row: "Homeworks", 25
row: "Projects", 25
row: "Code Check-ins", 15
row: "Exams", 15
end
```
```
>>> bar-chart(cs111-syllabus-table, "course-component", "grade-weight")
```
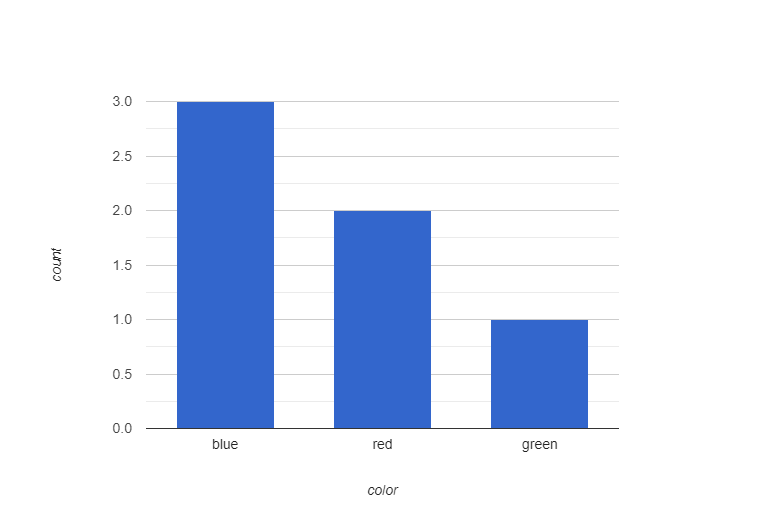
#### ***freq-bar-chart***(t :: Table, vs :: String) -> Image
Display an `Image` of a frequency bar-chart from the given `Table`. There is one bar for each unique value of the column with name `vs` (showing the number of occurrences of that value).
* **Example:**
```
favorite-colors-table = table: color :: String
row: "blue"
row: "red"
row: "green"
row: "blue"
row: "blue"
row: "red"
end
```
```
>>> freq-bar-chart(favorite-colors-table, "color")
```
#### ***box-plot***(t :: Table, vs :: String) -> Image
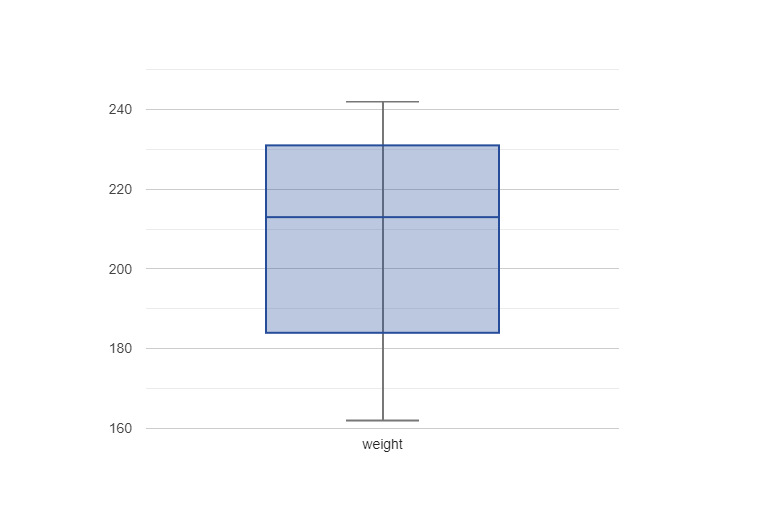
Produces an `Image` of a box plot of the values in the column named `vs` in the `Table`. A box plot shows the minimum, maximum, and median values of a column, as well as the first (lowest) and third quartiles of the dataset; this is helpful for seeing the variation in a dataset.
* **Example:**
```
>>> box-plot(height-weight-table, "weight")
```